You have a model. You have a GPU, or a budget for one. Will it serve? TFLOPS will not tell you. These four numbers will, in this order.
flowchart LR
  A["1 Memory<br/>does it fit?"] --> B["2 Bandwidth<br/>how fast per token?"]
  B --> C["3 Precision<br/>what math is native?"]
  C --> D["4 Scaling<br/>one card or many?"]
  A -. "no? shrink it" .-> C
1. Memory: does it fit?
Three things need room on the card.
flowchart TB
  subgraph GPU["H100, 80 GB"]
    W["weights<br/>params × bytes"]
    K["KV cache<br/>grows with users × context"]
    O["overhead<br/>CUDA, engine, 1–3 GB"]
  end
Weights are simple: parameters × bytes per parameter.
| Precision | Bytes/param | 8B | 70B | 405B |
|---|---|---|---|---|
| BF16 | 2 | 16 GB | 140 GB | 810 GB |
| FP8 / INT8 | 1 | 8 GB | 70 GB | 405 GB |
| INT4 / NVFP4 | 0.5 | 4 GB | 35 GB | 203 GB |
KV cache is the one juniors forget. Every token of every open request keeps its keys and values on the card:
KV\ per\ token = 2 \times layers \times kv\_heads \times head\_dim \times bytes
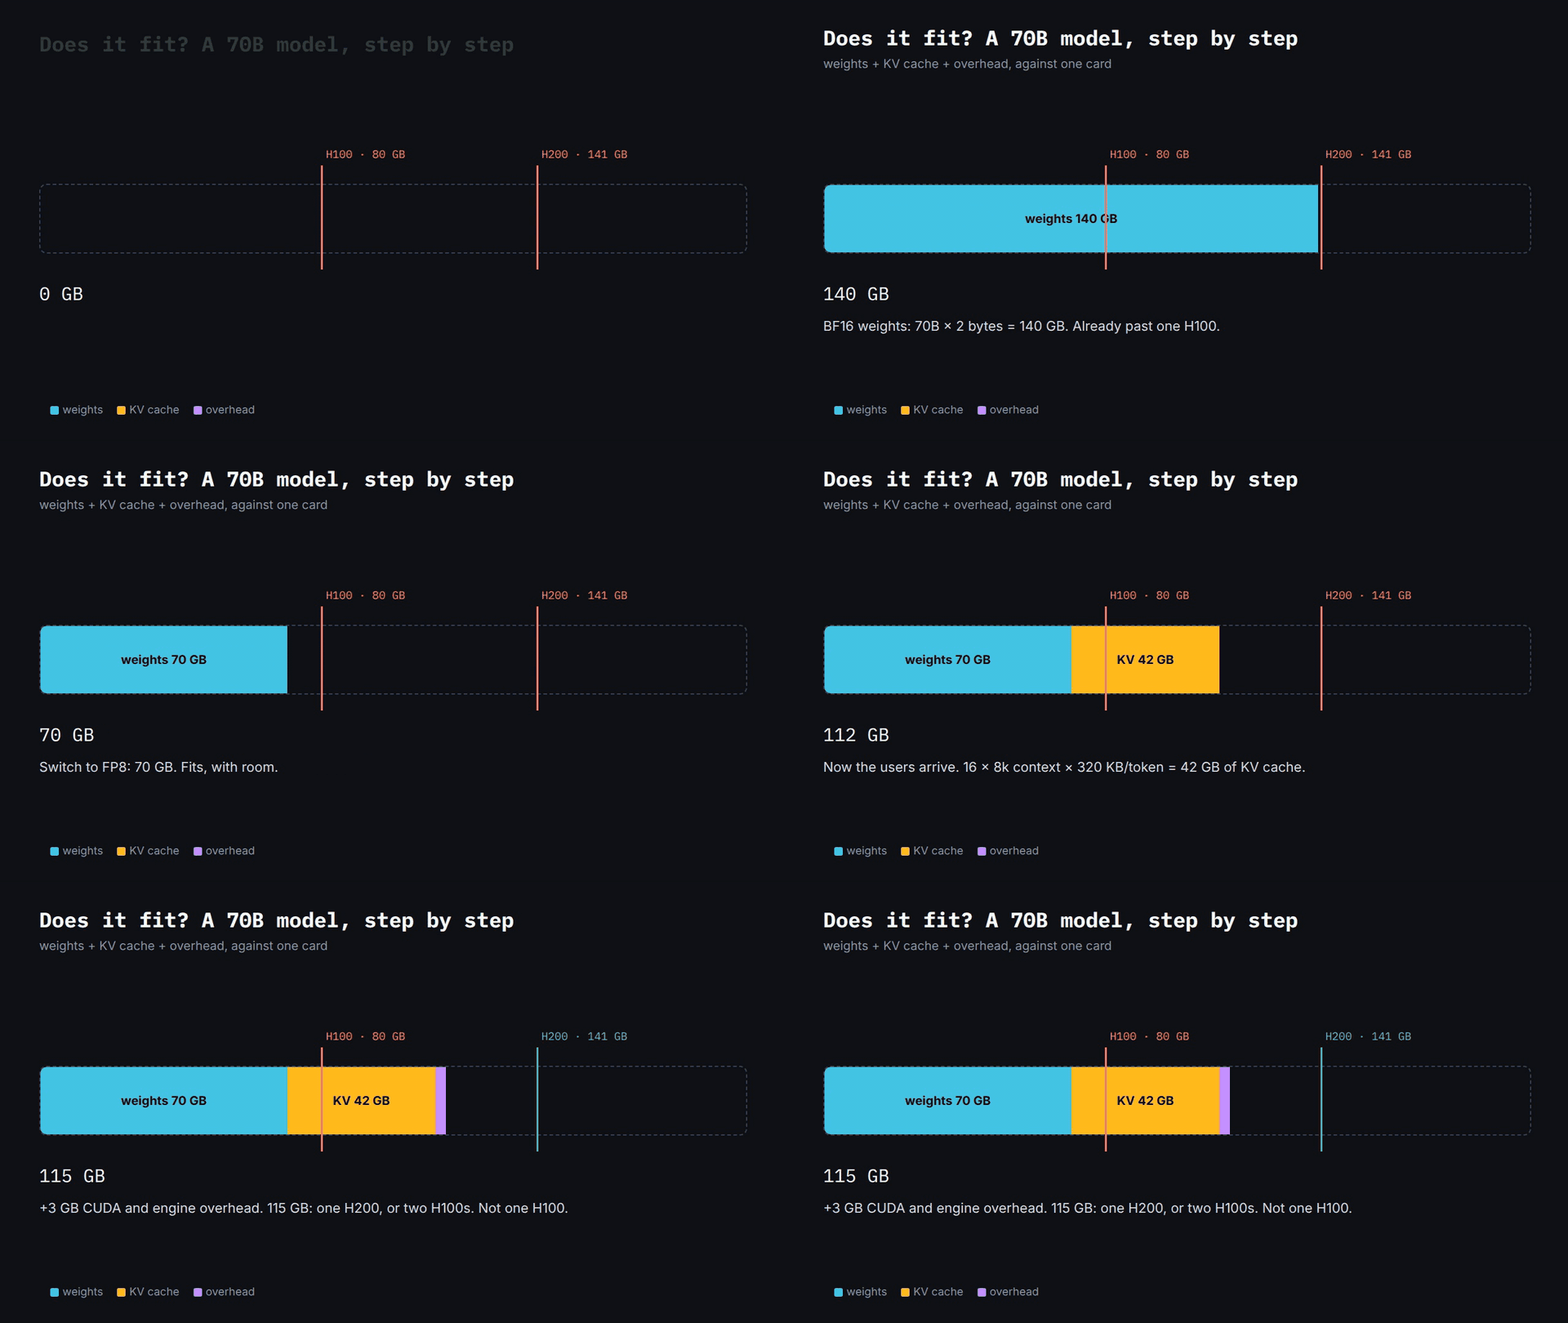
Llama-3-70B, BF16: 2 × 80 × 8 × 128 × 2 = 320 KB per token. 16 users at 8k context = 42 GB. On top of 140 GB of weights. So a 70B model with real traffic needs about 185 GB, not 140.
Two things change that number a lot. GQA (8 KV heads instead of 64) is why modern models serve well. MLA (DeepSeek style) caches a small latent instead of full K and V, ten times smaller again. Read the architecture, not the parameter count.
How to check: vLLM prints, at startup, how much memory went to weights and how many KV blocks are left. Zero blocks means the model loaded and can serve nobody.
What we built: two calculators. A rough one for planning, weights × 1.3, 0.9 × VRAM usable, ceil for GPUs per replica. A precise one that reads only the safetensors headers, no weights, and returns params, bytes per param, KV per token, KV at max context and valid parallel sizes in under a second. The rough one answers “how many cards?”; the precise one stops a user from picking a card the model cannot fit.
2. Bandwidth: how fast can a token move?
To make one token, the GPU reads every weight once. So for one user, speed is memory speed:
tokens/s \approx \frac{bandwidth}{bytes\ per\ token}
flowchart LR
  HBM["HBM<br/>70 GB of weights"] -- "3.35 TB/s" --> SM["compute"]
  SM --> T["≈ 48 tokens/s<br/>one user, 70B FP8, H100 SXM"]
Batching reuses the weights across users, so aggregate throughput goes up. But batching grows the KV cache. Step 1 and step 2 pull against each other.
The spec-sheet trap: same name, different bus.
| GPU | Memory | Bandwidth |
|---|---|---|
| A100 40 GB PCIe | 40 GB | 1.55 TB/s |
| A100 80 GB SXM | 80 GB | 2.0 TB/s |
| H100 PCIe | 80 GB | 2.0 TB/s |
| H100 SXM | 80 GB | 3.35 TB/s |
| H200 | 141 GB | 4.8 TB/s |
| MI300X | 192 GB | 5.3 TB/s |
How to check: two DCGM metrics side by side. DRAM_ACTIVE high and GR_ENGINE_ACTIVE low means bandwidth-bound: a faster bus or a smaller dtype helps, more TFLOPS does not. Two gotchas from production: the DCGM exporter stops at 128 metrics per GPU, so pick your counters, and a brand-new card model may not report the profiling counters until you add them.
3. Precision: what does the card run natively?
Smaller dtype = fewer bytes = steps 1 and 2 both improve. But only if the tensor cores speak that dtype.
| GPU | BF16 | FP8 | INT8 | FP4 |
|---|---|---|---|---|
| A100 | yes | no | yes | no |
| H100 / H200 | yes | yes | yes | no |
| B200 / B300 | yes | yes | yes | yes |
| MI300X | yes | yes | yes | no |
An A100 runs an FP8 checkpoint by converting it back up. You paid for nothing.
The policy in our planner: pick the smallest quantization the card supports. Prefer NVFP4 or MXFP4 over plain INT4 (per-block scaling, better quality at the same bits). If the card’s supported list is unknown, assume BF16 only and say so. Guessing is how you promise FP8 on a card that cannot do it.
How to check: run the model’s own benchmark per dtype. Watch tokens/s and an eval score together. Quantization is free speed until the eval drops.
4. Scaling: one card or many?
flowchart TB
  M["model does not fit<br/>on one card"] --> TP["tensor parallel<br/>split every layer<br/>needs NVLink, same node"]
  M --> PP["pipeline parallel<br/>split by layers<br/>can cross nodes"]
  N["model fits, need<br/>more traffic"] --> R["replicas<br/>N copies behind a gateway"]
  S["model is small"] --> MIG["MIG<br/>split one card into up to 7"]
Tensor parallel has rules. tp must divide the attention heads, and the KV heads must divide tp or be divisible by it. Our inspector computes the valid list per model, and the serving template takes tp from the platform, not from the user. “8 GPUs” on a model with 40 heads is a crash at startup.
MIG is the other direction. One H100 becomes up to seven isolated slices, each serving a small model. We made slices a first-class resource next to whole cards, and learned one thing the hard way: every slice was being given the whole card’s share of the node’s CPU, so a one-seventh slice looked as big as a full card. Now the allowance scales with the slice, 2 cores for a seventh, 14 for the card. Bandwidth scales the same way.
How to check: nvidia-smi topo -m. Kubernetes tells you how many GPUs; only topo tells you which pairs are NVLinked.
The routine
- Weights + KV at real concurrency + overhead. Which card, which precision?
- Bytes per token ÷ bandwidth. Is one-user latency fine?
- Is that precision native on that card?
- Many cards: valid
tp? NVLink? Or just replicas?
TFLOPS come in at step 3, for long prompts, where compute finally matters.
Where this simplifies
- The KV formula is for dense attention. Paged attention and prefix caching lower the real number. Measure with your own prompts.
- The bandwidth ceiling is for plain decoding. Speculative decoding reads the big model less often and beats it.
- Cost is not in the four numbers. One card that fits is usually cheaper per token than two that need NVLink.