For about a year I have been the person the ticket lands on when a model endpoint answers 503, 500, or “server unreachable”. Different clusters, different models, same ticket title. Here is what it turned out to be, sorted by where the request actually died.
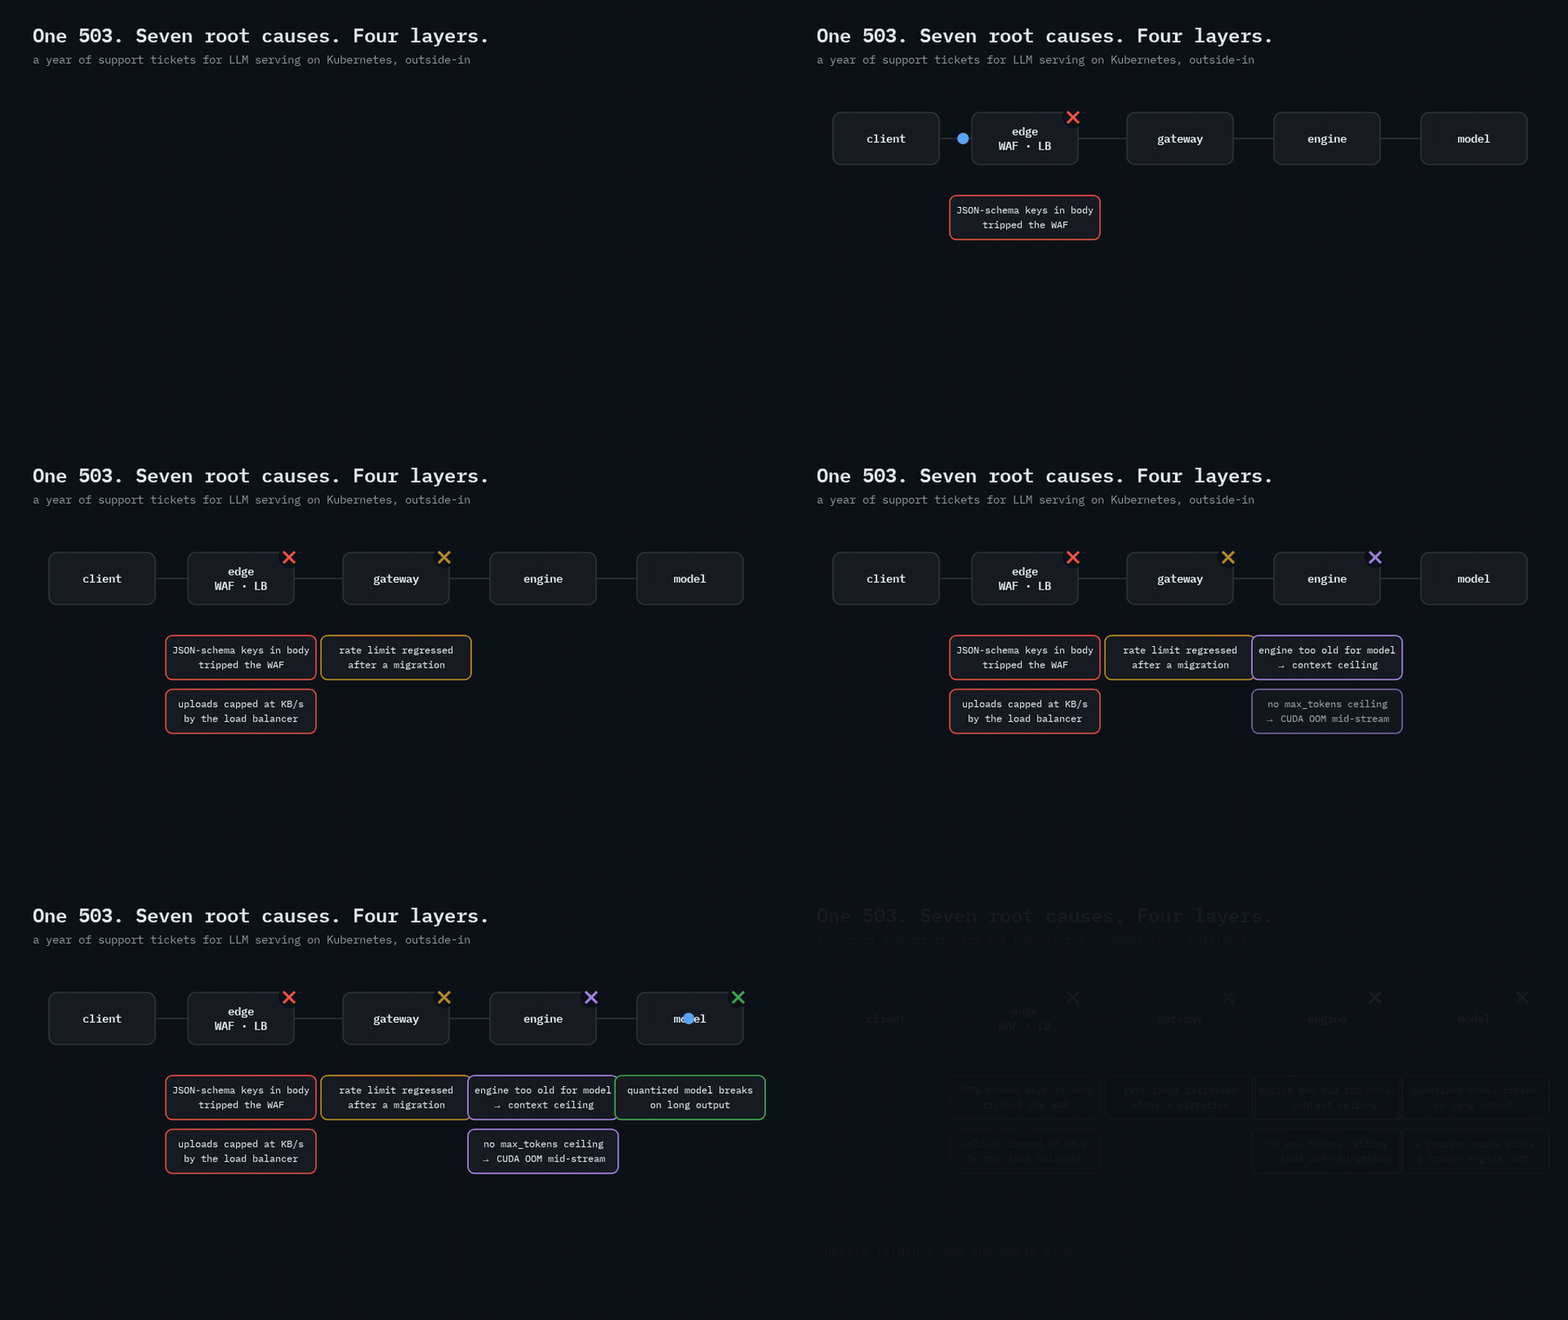
Almost none of these were the model. Most were something in front of it.
Edge: WAF and load balancer
The request never reached the cluster. It looked exactly like an outage.
- The WAF blocked JSON-schema keywords. Four tickets, four different models, one symptom: “Server Unreachable” right after a successful deploy, pod happily Running. The bodies contained
$refand$defs— the keys you get from tool-calling and structured-output schemas — and a WAF signature treated them as an attack. Fix: allow-list the signature for the inference path. Lesson: test tool-calling payloads through the edge, not from inside the cluster. - Uploads throttled to KB/s. Multimodal requests “hung”. A 300 KB image took 55 seconds before the model saw it. Same request against the ingress directly: 0.14 s. The external load balancer was capping upload throughput at 10–45 KB/s while the inside path did 2–4 MB/s. Nothing in the cluster was slow. Fix: hand the two numbers to the network team. Lesson: measure from both sides of the edge before you touch a single model flag.
- A size threshold. Model deploys through the edge failed outright; a request parameter exceeded a configured limit at the load balancer. One setting, one line.
Gateway: rate limits
- A rate limit regressed after a migration. A busy model started returning 503. The limit lived in a gateway route plugin; after moving routes, the value came back lower than before. Fix: raise it — and put the value in version control. Lesson: limits are configuration, and configuration drifts when nobody owns it.
Engine: how the server was launched
- Engine too old for the model. A new large model on an engine version older than its recipe recommended, with no KV-transfer config. Fine on short prompts, collapsed under long context. Fix: newer engine plus the recipe’s config, which gave a ~240 GB KV cache and a stated 200K context ceiling. Lesson: follow the engine recipe for the model you are serving, and pin what you tested.
- No ceiling on output. An older server type generated tokens until CUDA OOM on a “hello, how are you” —
max_new_tokenshad no default and no minimum. The fix was eight lines: a default and a floor. Lesson: every generation parameter needs a server-side bound, because clients will not set one.
Model: it was the model
Sometimes it is. Twice, in a year.
- A quantized MoE model crashed on long outputs. Short prompts fine; a 2,000-token technical answer restarted the pod. Kernel env toggles made it worse (CrashLoop). Tuning
max-model-len,max-num-seqs, batched tokens, memory utilisation and eager mode stopped the crashes — and then the output degenerated into repeated!!!!on math prompts. The quantized build was broken; an upstream issue was already open. Lesson: keep a long, technical prompt set in the onboarding checks. “It answered hello” is not a test. - One request parameter picked a broken engine path. A video model returned 500 only when
quality: highwas set. First theory was a tensor-parallel race creating a cache context. Real cause: that parameter selected a cache policy the engine could not run with two task heads loaded. Fix: pin the task type at launch, bump the engine dependency. Workaround until then: omit the parameter.
The lie that cost the most time
In the last case, /health returned 200 for the whole incident while every real request returned 500. The readiness probe checked that a process was listening. It did not check that the model could answer.
graph LR
    A["/health<br/>process up?"] -->|200| B["traffic routed"]
    B --> C["POST /v1/chat<br/>500"]
    D["/ready<br/>tiny real inference"] -->|fails| E["pod pulled from rotation"]
    style C fill:#f8514922,stroke:#f85149
    style E fill:#3fb95022,stroke:#3fb950
Readiness should run a real request: one token, a fixed prompt, a tight timeout. It costs almost nothing and it is the difference between “pod is up” and “pod can serve”.
How I triage now
Outside-in, and prove each layer before moving on:
- Reproduce from inside the cluster with
curl --resolveagainst the ingress. If it works inside, stop looking at the model. - Diff the two paths with numbers: status code, upload speed, time to first byte. Numbers are what the network team can act on.
- Check the gateway config against what is in git. If nothing is in git, that is the finding.
- Read the engine launch line — version, KV settings,
max_model_len, output bounds. Compare with the model’s recipe. - Only then run the long, technical prompts. If it breaks here, it is the model, and the fix is a different build.
What I would do differently
- Put the edge in the test plan. A staging path that goes through the same WAF and load balancer as production would have caught two of these before any customer did.
- Version every limit: rate limits, size thresholds, generation bounds. A limit nobody can
git blamewill drift. - Make readiness mean “can answer”, not “is listening”.
- Keep an onboarding prompt set that includes one long technical answer and one structured-output call. Cheap, and it catches both the quantization failure and the WAF signature.