A normal web request is one number: how long it took. An LLM request is not one number. It trickles out token by token, so a single “duration” hides almost everything that matters.
Here is one request, and the numbers it leaves behind.
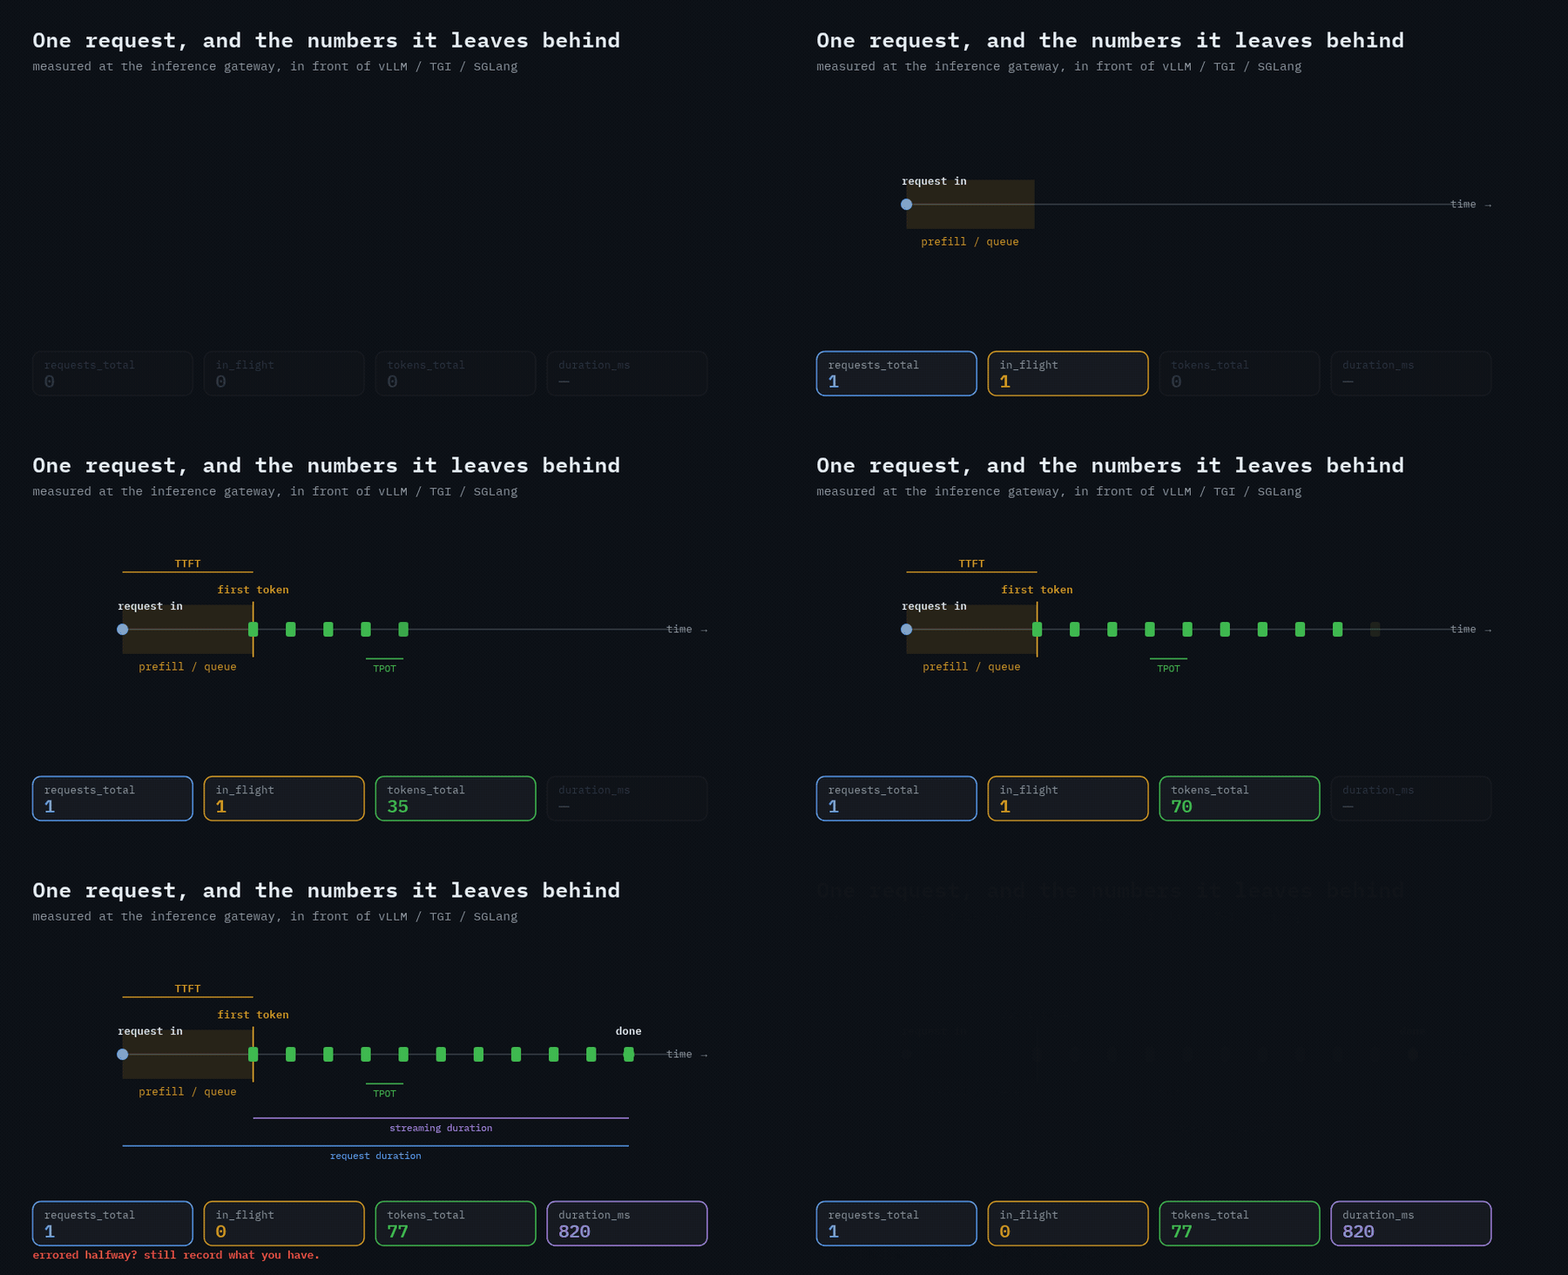
The picture, in words
Four things happen on that line, and each one is a different metric:
- Time to first token (TTFT) — request in, until the first token comes back. This is prefill plus however long the request waited in the queue. It’s what a user feels as “did it hang?”
- Time per output token (TPOT) — the gap between tokens once they start. This is decode speed. Multiply it out and you get how long a long answer takes.
- Streaming duration — first token to last. The part of the request that was actually generating.
- Request duration — request in to done. TTFT plus streaming. The old single number — still useful, but on its own it can’t tell a slow queue from a slow model.
TTFT and TPOT are the two the user actually feels. If you only add two metrics, add these.
Counter or gauge?
The type isn’t a detail — it decides what you can ask later.
graph TD
    A["what do you want to ask?"] --> B["how many? (only goes up)"]
    A --> C["how much, right now?"]
    A --> D["what's the spread?"]
    B --> B1["counter<br/>requests_total, tokens_total"]
    C --> C1["gauge<br/>in_flight, last duration"]
    D --> D1["histogram<br/>latency buckets → p50/p95/p99"]
- Counters only go up.
requests_total,tokens_total,chunks_total. You take the rate: requests per second, tokens per second. - Gauges are a value right now.
in_flight(concurrent requests) is the one to watch — it climbs before latency does, so it warns you early. - Histograms give you the shape. Latency as an average lies; you want p95 and p99. A histogram is the only type that answers “how bad is the slow tail.”
A common miss: recording latency as a gauge. A gauge keeps the last value, so two slow requests hidden between fast ones vanish. If you care about the tail — and for latency you do — it has to be a histogram.
Label by model, but not by everything
Every metric gets a model label, because one tenant’s model being slow is invisible in the global number. Add status too, so you can split success from failure.
What not to label: anything unbounded — user id, request id, prompt text. Each new label value is a new time series. Put a request id in a label and you can take the whole metrics backend down. That’s not a hypothetical; it’s the classic way to do it.
The bug everyone ships
Metrics recorded at the end of the handler, on the happy path:
resp = await proxy(request)
metrics.record(model, resp.tokens, resp.duration)   # never runs if proxy() raised
return resp
The requests you most want to see — the ones that timed out, got killed mid-stream, or blew the token budget — are exactly the ones that never reach that line. Your dashboard looks calm while users are getting errors.
Record in a finally, so the error path counts too:
start = now()
tokens = 0
try:
    resp = await proxy(request)
    tokens = resp.tokens
    return resp
finally:
    metrics.record(model, tokens, now() - start, status)
A partial number beats a missing one. A request that streamed 40 tokens and then died is real load and real cost — record the 40.
Where I’d start
If you’re standing up a gateway tomorrow, in order:
requests_total{model,status}— a counter. Rate and error rate.in_flight{model}— a gauge. Your earliest warning.- TTFT and request duration as histograms — the two latencies users feel.
tokens_total{model}— a counter. Throughput, and the honest input to cost.
Four metrics, recorded in a finally, labelled by model. That’s most of the value. Everything else is refinement.